Finding the right items and runes builds in LoL yields high returns at a minimal cost to players. It is an important part of the analyst’s job as finding those builds is mostly about optimisation and research.
So far, finding the right item builds has mostly been a trial and error process, focused on analytics and experience more than prediction and machine learning. Sometimes, egregiously powerful items have flown under the radar for many months (2016 Ardent Censor) or never got their time to shine despite being incredibly powerful (Essence Reaver until patch 9.2).
Marksmen builds — Damage maximisation#
Marksmen are a very particular class of champions in League of Legends. As primary damage dealers, their whole itemization revolves around damage output maximisation.
At the same time, maximizing damage doesn’t mean not buying defensive stats, as dead players don’t contribute much. Marksmen always have to thread the needle between damage and survivability, with lifesteal one of the stats able to bridge the gap.
Thankfully, I have at my disposition 300 000 games where I know the final damage output of marksmen as well as their items, the champion the played, their teammates, and so on. Since we have the result on hand, why not use machine learning to try and predict damage output from as few inputs as possible?
Predicting DPS from items#
My first idea was using a linear regression so I could easily access the model’s coefficients. I had the intuition that damage was highly correlated to items, and that after normalizing damage output on a few factors it would be possible to predict it decently enough only from items. I therefore started to craft a “damage metric” that was as correlated as possible to the items. I also restricted my analysis to games between 20 and 40 minutes, because games outside of this range have a high chance of being outliers.
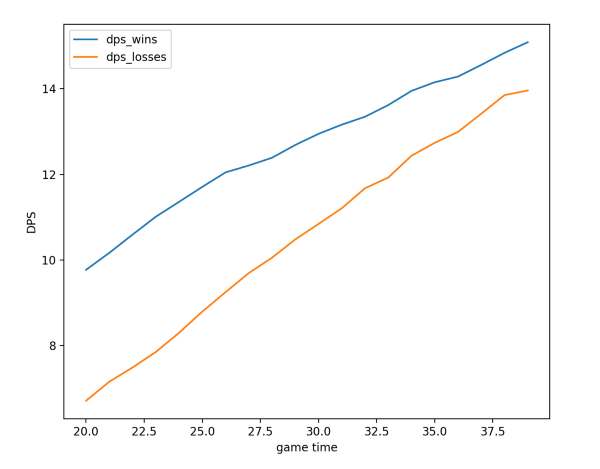
The usual “scaled” metric used by analysts is DPS, total damage divided by game duration, but since marksmen damage doesn’t progress linearly over the course of the game it was still highly correlated to game duration. Another important factor in damage output is the result of the game, with marksmen being able to dish out much more damage in victories, especially shorter ones.
For starters, I decided to run the algorithm only with items as the input and my “dps score” as the output.
To not over-fit on niche items, I decided to only take into account items that appeared in more than 5% of the games and cost more than 500 gold. I represented the items with a one hot vector. I appended it with more one hot fields representing couples of items, like IE + Statikk Shiv, because I thought items synergies were a major factor in damage output for marksmen.
On another note, it took me about an hour to find the right way to index the vector, but I was pretty proud to find that the solution was, for items i and j, i*items_list_length-(i*(i+1)/2)+j. Hurray for basic maths.
So, with items_vectors and scaled_dps_scores representing our inputs and outputs, here is the code I ran, using methods from sklearn:
# Model calculation and validation
X_train, X_test, y_train, y_test = train_test_split(items_vectors, scaled_dps_scores, test_size=0.2)
lm = LinearRegression()
lm.fit(X_train, y_train)
# Display the results vs prediction. Should be close to a diagonal.
predictions = lm.predict(X_test)
plt.scatter(y_test, predictions)
plt.show()
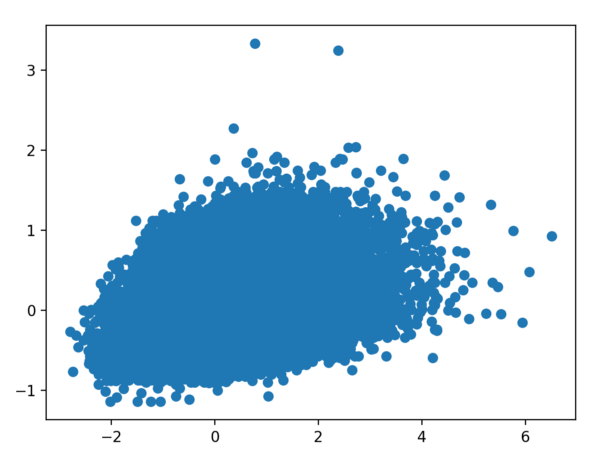
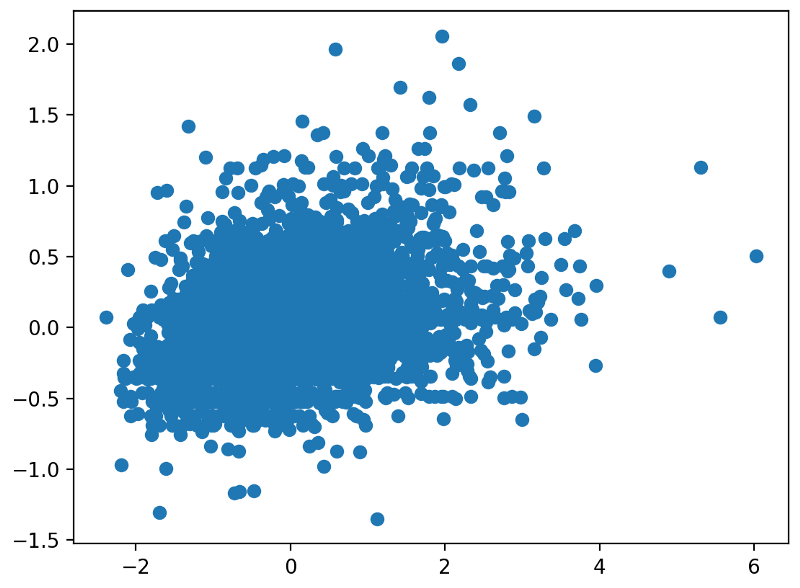
As you can see, accuracy wasn’t great. At the same time, I saw there was definitely some correlation. I already took a look at those coefficients, and they were coherent with our current understanding of the game, with Infinity Edge coupled with Zeal items displaying the highest values.
As I was curious about the accuracy of my hypothesis, I decided to use a dense neural network with the same data set. Neural networks are way harder to exploit than a simple linear regression, but they’re also much more powerful at predicting the output.
Even with a neural network, my results were very similar, with only a 10% precision gain on cross_val_score. This meant that my hypothesis was too optimistic, and that I needed to feed more information to the algorithm if I wanted more precise predictions.
I therefore added the champion used as another layer of normalisation on the DPS score I crafted.
Same graph as before, but with dps_score including normalisation on the champion used
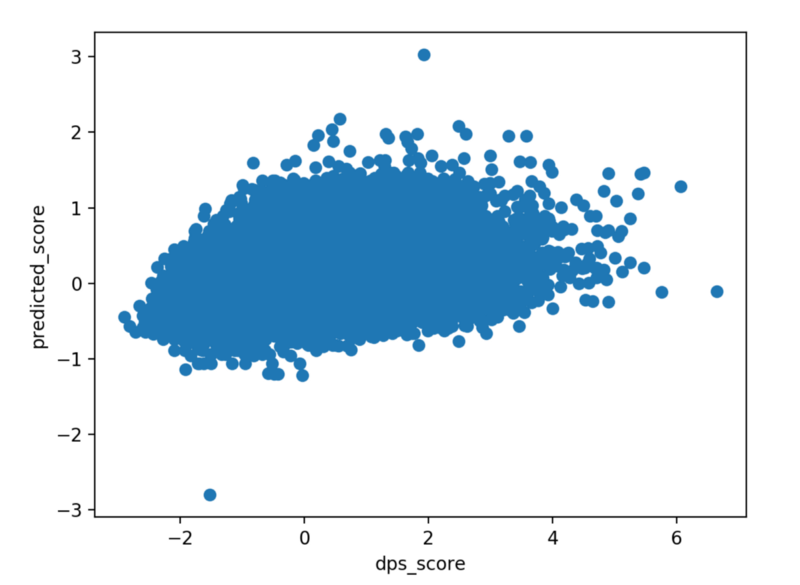
That’s even worse. The difficulty at that point was clearly that taking all champions into account at once was very tough, as champions will use items with varying efficiency. Where Infinity Edge increases DPS the most on Sivir, maybe Guinsoo was best at increasing DPS on Kai’Sa. I therefore decided to reduce the scope and run the algorithm on a single champion to see if I would get a higher accuracy.
dps score against predictions for a single champion (Sivir)
Well, that looks a bit better! while our predictions are still too tame, we see that predictions are getting closer to the x=y diagonal.
At this point, I had already spent quite a bit of time on what was supposed to be a small proof of concept, and I cut my research short. I produced coefficients tables for all marksmen used by my team, and wrote a short report analyzing those results. Once again, what matters to my position is to deliver actionable feedback to the team, so that’s where I put my focus!
Analyzing items prices#
But this previous method only works for a very specific use case. Marksman is the only position that is only about damage maximisation, and other positions have way more variables to take into account when deciding on a build order.
A metric I always enjoyed when analyzing LoL was gold efficiency. It looks at the cost of “raw stats” provided by an item and tells you how much you’re paying for their passive/active effects. Many historically powerful items simply had a high gold efficiency, but the proliferation of complex effects has made it harder and harder to use this stat.
Also, using only basic items to determine the intrinsic cost of stats has its shortcomings, since some finished items get bonus stats to create stronger power spikes.
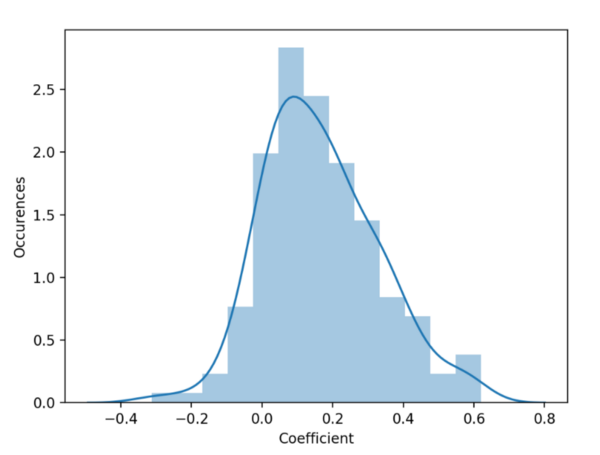
See where I am going? Once again, a linear regression is a great way to solve the problem! By representing items by their stats, it is possible to use a linear regression to compute the “true” gold value of each stat.
To do that, I tried to group similar effects as much as I could. For example, I grouped all “cold steel” passives and represented them with a field having a value of 1, then counted Frozen Heart as 1.2 cold steel passive. In the same way, I grouped Sheen passives, QSS, tenacity… This method means I introduced some personal biases, but it also helped me take into account many more items when calculating the gold value of effects.
Finally, I used a one-hot encoding for items which had tough to model effects. This meant the factor in front of those values would represent the price of the effects. You can see this as a constant linked to the item, which means all those items would end up perfectly “predicted” by the linear regression.
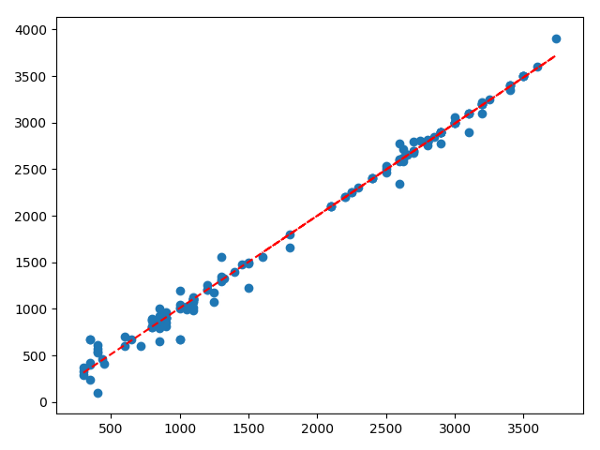
Items gold price vs predicted gold price from a linear regression
After running the linear regression, once again using sklearn, I ended up with “actual” gold efficiency for all items in the game, as well as costs for all passives. In the event of nerfs or buffs, I will be able to go back to those to quickly identify how much better the item got!
My next step will be looking at specific use cases for items, for example 3s of auto attacking and one use of all spells, to see how each stat influenced the final result. This will allow me to compute breakpoints for stats, where it becomes more valuable to buy another similar stat because of the added gold efficiency, like armor against HP or attack speed against AD.
Conclusion#
Despite not reaching an indisputable conclusion as to what the best items in LoL are, I still managed to identify strong groups of items. Starting from simple assumptions, and using basic machine learning methods, I was able to provide Splyce’s players with never seen before insights on item builds!
But of course, there is more to it, and I plan on continuing to look for better way to identify strong builds and automatically alert the team, so we’re on top of the next on-hit Neeko. But this is more linked to analytics than machine learning, and therefore not as fun!
I hope you enjoyed this insight on my work at Splyce. Next time I will make a shorter post about role recognition, something that I needed to implement pretty early to have reliable cs difference calculations!
PS: WE MADE PLAYOFFS LET’S GOOOOOOOOOOOOO